
Preventive Maintenance Water Parks for Uptime and Profitability
Updated: Sep 11
Water Park Preventive Maintenance for Uptime and Profit
Learn how preventive maintenance protects water park uptime, safety, CAPEX planning, and profitability with practical budgeting benchmarks.
A water park does not lose money only when a pump fails. It loses money when a major slide tower closes on a peak weekend, when water quality drifts out of range, when guests notice worn surfaces, or when capital gets spent on emergency repairs instead of the next high-impact attraction.
For owners, operators, investors, and development stakeholders, preventive maintenance water parks planning is a financial discipline. It protects uptime, supports guest safety, extends asset life, and gives leadership a clearer view of future capital needs.
The best-run parks do not treat maintenance as a back-of-house cost to trim. They treat it as a core driver of revenue protection and long-term asset value.

Why Preventive Maintenance Protects Uptime, Safety, and Profit
Water parks are asset-heavy businesses. Slides, pumps, filtration systems, wave pools, lazy rivers, safety surfaces, control systems, theming, food and beverage equipment, and locker systems all need coordinated care. A single weak point can disrupt the whole guest experience.
Uptime is Revenue Protection
Downtime has a direct cost. When a headline slide closes, the park loses capacity, queue balance, guest satisfaction, and sometimes group or season pass confidence. The financial impact often extends beyond the repair invoice:
Lower per-capita spending when guests leave earlier.
Refunds, rain checks, or reputation damage.
Higher labor cost per visitor due to inefficient attraction rotation.
Lost peak-day revenue if capacity falls below demand.
More pressure on remaining attractions, which speeds wear.
Preventive maintenance lowers these risks by shifting work from emergency response to planned intervention. That improves scheduling, parts management, staffing, and attraction availability.
Safety is an Operational System
Guest safety depends on more than lifeguards and operating procedures. It also depends on slide surface condition, water chemistry, pump performance, decking, ride dispatch systems, signage, and drainage. A practical water slide maintenance program should include:
Daily visual inspections before opening.
Documented ride path checks.
Regular fiberglass surface reviews.
Joint, seam, and support inspections.
Flow rate and dispatch timing checks.
Manufacturer-guided annual inspections.
Corrective work logs signed by qualified personnel.
This documentation matters. It helps management act early, supports insurance and compliance reviews, and creates a record of responsible asset stewardship.
Profitability Improves When Surprises Decline
Emergency repairs often cost more than scheduled maintenance because they involve rush freight, overtime labor, unplanned closures, and temporary fixes. Preventive programs reduce those premiums. They also help the finance team forecast cash needs. When engineering, operations, and finance work from the same asset register, leadership can tell the difference between routine OPEX, major repair CAPEX, and expansion investment. That distinction is critical for water park budgeting.
How Much Should Water Parks Budget for Preventive Maintenance?
There is no single number that fits every park. A year-round destination park in a humid coastal market has different needs than a seasonal regional park. A new park with modern filtration and slide systems will not carry the same near-term burden as a 15-year-old property with deferred repairs.
Even so, successful parks tend to work within disciplined ranges.
Practical Annual Maintenance Ranges
As a planning benchmark, mature water parks often allocate maintenance using two views:
| Budget Basis | Typical Planning Range | Best Use |
|--------------|------------------------|----------|
| Percentage of Annual Revenue | 4% to 8% | Helpful for annual operating budgets |
| Percentage of Replacement Asset Value | 2% to 4% | Better for long-term asset protection |
| Percentage of Total OPEX | 6% to 12% | Useful for department-level control |
| Annual CAPEX Reserve for Renewals | 4% to 10% of revenue | Supports major replacements and refreshes |
Newer parks may sit near the lower end for the first few years, but they should still fund inspections, cleaning, water systems, and early warranty management. Older parks, heavily themed parks, and parks in harsh climates often require the upper end or more for catch-up work.
Deferred maintenance does not disappear. It usually returns as higher CAPEX, lower uptime, or reduced guest confidence.
What Belongs in the Preventive Maintenance Budget?
A strong annual budget separates routine work from capital renewal.
OPEX Maintenance Items
Routine maintenance should usually include labor, consumables, chemicals, small parts, inspections, cleaning, water testing, lubrication, minor fiberglass repairs, and regular servicing.
CAPEX Renewal Items
Capital planning should include pump replacements, slide resurfacing, major filtration upgrades, control system replacements, structural repairs, deck replacement, guest amenity refreshes, and large-scale theming repairs.
This split helps owners avoid one of the most common mistakes in water park finance: paying for long-life asset renewals from a thin operating budget, then underfunding daily maintenance to compensate.

Recommended CAPEX, OPEX, and Profit Margin Planning
Water park financial planning works best when leadership sets target ranges before the budget season begins. The numbers below are general planning benchmarks, not investment advice. Actual results depend on market, attendance, debt structure, seasonality, ticket yield, labor cost, and asset age.
A Balanced Model for Mature Water Parks
| Category | Recommended Planning Range | Financial Reasoning |
|----------|----------------------------|---------------------|
| OPEX | 55% to 70% of revenue | Covers labor, utilities, maintenance, insurance, marketing, administration, and guest services |
| Preventive Maintenance within OPEX | 4% to 8% of revenue | Protects uptime and reduces emergency repair exposure |
| Annual CAPEX Reserve | 4% to 10% of revenue | Funds renewals, upgrades, resurfacing, mechanical replacements, and guest-facing refreshes |
| EBITDA or Operating Profit Before Debt and Tax | 15% to 30% of revenue | Gives the business capacity to service debt, reinvest, and absorb weak weather periods |
For a park generating $20 million in annual revenue, this model may imply:
| Item | Lower Range | Upper Range |
|------|-------------|-------------|
| OPEX | $11.0 million | $14.0 million |
| Preventive Maintenance | $800,000 | $1.6 million |
| CAPEX Reserve | $800,000 | $2.0 million |
| Operating Profit Before Debt and Tax | $3.0 million | $6.0 million |
The right answer is rarely the lowest number. A park with major slide complexes, wave pools, heavy food and beverage operations, or strong peak-day demand should protect capacity first. Underfunding maintenance can raise short-term margins while weakening the asset.
How to Link Maintenance Spending to Profit
Maintenance should be measured against business outcomes, not only work orders completed. Useful management metrics include:
Attraction availability by day and by hour.
Lost operating hours by asset.
Emergency repairs as a share of total maintenance cost.
Cost per operating hour by attraction.
Guest complaints tied to facility condition.
Repeat failure rate by asset.
Maintenance backlog by risk level.
Energy use per visitor or per operating hour.
These metrics connect operational efficiency water parks goals with financial reporting. They also help investors distinguish a well-managed asset from one showing temporary cash flow because needed work has been delayed.
Water Park CAPEX Planning for Expansions and Future Attractions
Most parks need a major marketable addition every few years to maintain attendance growth, media interest, and season pass value. That makes water park CAPEX planning a rolling process, not a once-a-decade event.
Plan in Three Development Cycles
A practical capital roadmap should cover three time horizons.
| Planning Horizon | Focus | Typical Projects |
|------------------|-------|------------------|
| 0 to 24 months | Reliability and quick revenue gains | Pump upgrades, cabana expansion, shade, food outlets, slide resurfacing, queue improvements |
| 3 to 5 years | Marketable attraction growth | New slide tower, kids’ water play zone, wave pool enhancements, water coaster, lazy river extension |
| 6 to 10 years | Positioning and destination value | Land expansion, resort tie-ins, major themed zones, second gate, integrated retail or dining district |
This approach keeps the park from choosing between maintenance and growth. Both need funding.
Budget for Attraction Development Costs Beyond the Ride
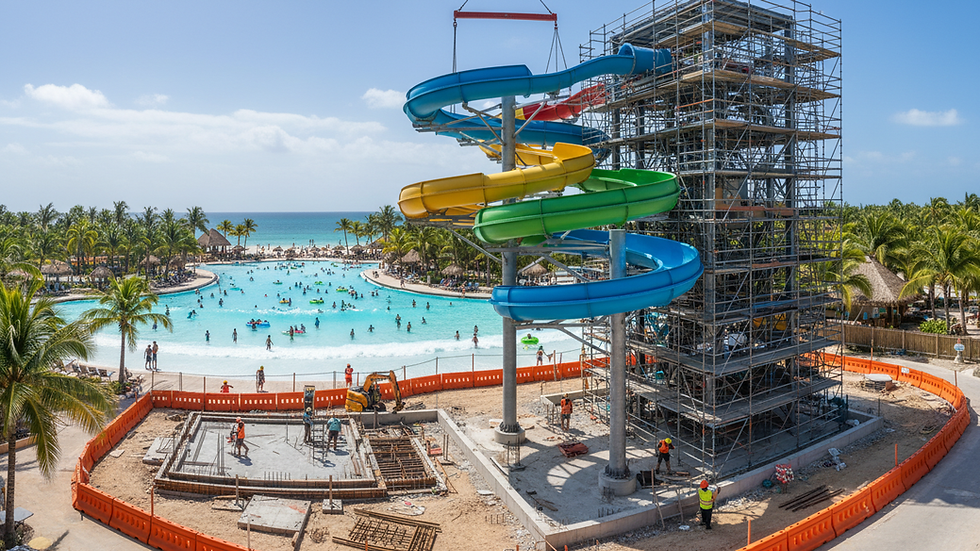
Attraction development costs include more than the slide or water feature package. A common budgeting error is to price the headline element and underestimate the supporting infrastructure.
For a new slide, budget categories may include:
Design, engineering, and permitting.
Civil works and foundations.
Tower structure.
Slide path, rafts, mats, or tubes.
Pumps, filtration, and water treatment.
Electrical and controls.
Queue layout and shade.
Lifeguard positions and sightlines.
Landscaping, lighting, and theming.
Lockers, cabanas, and food and beverage adjacency.
Testing, training, and commissioning.
Contingency.
For early planning, a contingency of 10% to 20% is common for projects with clear scope. Higher contingencies may be needed for complex sites, imported equipment, uncertain ground conditions, or phased construction around operating seasons.
Budgeting Strategies for New Slides and High-Impact Attractions
A new attraction should earn its place in the capital plan. That means finance, operations, and development teams should review both the revenue upside and the cost of ownership.
Build a Full Life-Cycle Business Case
A useful business case should include:
Expected attendance lift.
Ticket yield impact.
Season pass renewal impact.
Cabana, locker, food, and retail upside.
Incremental staffing.
Utility demand.
Maintenance cost.
Parts availability.
Training requirements.
Annual inspection needs.
Expected refurbishment cycle.
Replacement horizon.
A high-throughput family attraction may create more value than a visually dramatic ride with low capacity. The right choice depends on market demand, guest mix, and operational fit.
Protect the Capital Reserve
Owners sometimes fund new attractions by starving renewal CAPEX. That may produce a short-term attendance bump, but it can weaken the rest of the park. A better structure is to divide annual capital into three pools:
| Capital Pool | Suggested Share of Annual CAPEX | Purpose |
|--------------|----------------------------------|---------|
| Asset Preservation | 40% to 50% | Keeps existing attractions safe, reliable, and presentable |
| Revenue Growth | 30% to 40% | Funds new slides, cabanas, food outlets, and paid experiences |
| Guest Experience and Efficiency | 10% to 20% | Improves shade, circulation, digital lockers, queuing, and energy use |
This mix can shift in a major expansion year, but asset preservation should not disappear.
Use Maintenance Data to Guide New Investment
Maintenance records reveal which attractions drive cost and which assets are approaching replacement. If a slide complex has rising repair costs, declining guest satisfaction, and limited capacity, replacement may create a better return than another patch cycle. That is where finance-led capital planning adds value. It compares ongoing cost, guest impact, and reinvestment options over time.
Real-World Examples from Water Park Development
Large destination parks and regional parks face different capital pressures, but the best practices are similar: keep the asset reliable, reinvest before the experience feels tired, and match new attractions to market demand.
Andamanda Phuket Shows the Value of Integrated Destination Planning
Andamanda Phuket is a large-scale water park destination in Thailand with themed zones, family attractions, dining, retail, and hospitality-driven guest flow. A park of this scale depends on disciplined maintenance because uptime affects more than ride count. It affects dwell time, spend per guest, online reviews, and the broader destination promise.
For a destination-style property, preventive maintenance should be built into daily operations and long-range capital planning. Slides, wave systems, water features, landscape elements, and guest amenities all shape the perceived value of the visit.
Columbia Pictures Aquaverse Highlights the Complexity of Themed Assets
Columbia Pictures Aquaverse in Thailand combines water attractions with entertainment intellectual property and themed environments. The business model places pressure not only on ride reliability but also on visual standards. For highly themed parks, maintenance budgets must cover finishes, props, lighting, paint, guest pathways, and show-quality details. These costs can sit outside standard mechanical maintenance, but they have a direct effect on pricing power and brand perception.
A Realistic Regional Park Scenario
Consider a regional water park with $12 million in annual revenue and strong summer attendance. The park has deferred slide resurfacing and pump replacements for three years to preserve cash. In year four, two major attractions experience repeated closures. The park spends $650,000 on emergency repairs, loses several peak operating days, and delays a planned kids’ water play project.
A stronger plan would have assigned:
$600,000 to $900,000 per year to preventive maintenance.
$600,000 to $1.2 million per year to CAPEX reserves.
A three-year resurfacing schedule.
A parts inventory for critical pumps and controls.
Monthly uptime reporting by attraction.
The park may have spent similar money over time, but with fewer closures, better guest feedback, and a clearer path to expansion.

FAQ
How Much Should a Water Park Spend on Preventive Maintenance Each Year?
Many mature parks plan for preventive maintenance at about 4% to 8% of annual revenue, or 2% to 4% of replacement asset value. Older or highly themed parks may need more.
Is Water Slide Maintenance an OPEX or CAPEX Item?
Routine inspections, cleaning, minor repairs, and servicing are usually OPEX. Major resurfacing, structural repairs, pump replacements, and large system upgrades are usually CAPEX.
How Often Should a Water Park Update Its CAPEX Plan?
A water park should review its CAPEX plan every year and maintain a rolling 3-year, 5-year, and 10-year view. This helps balance asset renewal with new attraction development.
What is the Biggest Budgeting Mistake Water Parks Make?
The biggest mistake is underfunding maintenance to improve short-term profit. This often leads to higher emergency repair costs, more downtime, and weaker long-term asset value.
How Do New Attractions Affect Operational Budgets?
New attractions can increase attendance and revenue, but they also add staffing, utilities, inspections, parts, training, and future refurbishment costs. A full life-cycle budget should include all of these items.
A Stronger Maintenance Plan is a Stronger Investment Plan
Preventive maintenance is not only an engineering responsibility. It is a financial strategy that protects revenue, safety, guest satisfaction, and long-term asset performance.
The parks that perform best over time tend to share the same habits. They fund maintenance before assets fail, separate OPEX from CAPEX, reserve capital for renewal, and plan new attractions around both market appeal and cost of ownership.
For owners and investors, that discipline creates a clearer view of risk and return. For operators, it creates fewer surprises and better daily performance.
To assess your park’s maintenance budget, CAPEX roadmap, or next attraction investment, book a destination development strategy call with Andaman Capital.


Comments